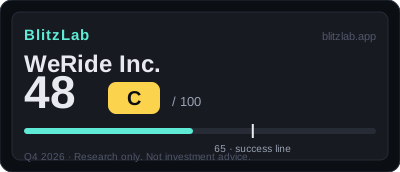
WeRide Inc. — Blitz Index 48 (C)
WeRide scores 48 — robotaxis and driver-assist growing 82% with overseas revenue up 164%, held back by a −190% operating margin and cash that has fallen from RMB 7.1B to 5.4B in six months.
Last re-scored: August 12, 2026.
Confidence: Medium · Category: frontier
Score breakdown
| Section | Score | Detail |
|---|---|---|
| A · Speed | 20 / 25 | Revenue +82% YoY, L2+/L3 driver-assist up 26×, overseas +164%, fleet +22% — speed of 80.0, among the highest in coverage |
| B · Moat | 26 / 60 | A large market (B3 9) and a growing fleet — but a 37.5% gross margin and a ~−190% operating margin (B4 4): speed with no proof it becomes economics |
| C · Creative destruction | 11 / 15 | Robotaxis and driver-assist displacing human driving at scale — a real displacement, paced by city permits and safety regulation outside WeRide's control |
| D · BlitzFailing | −9 | Cash down from RMB 7.1B to 5.4B in six months with breakeven targeted for 2029 (D1 −3); deep losses (D2 −2); city-permit and US–China listing risk (D4 −3) |
Think we scored it wrong? Score it yourself →
Radar axes (0–100): Moat 43.3 · Speed 80.0 · Creative 73.3.
Watch item
Gates: G1 ✓ (confirmed — growth real: revenue +82% YoY, L2+/L3 up 26×, paid rides at 21 per vehicle per day) · G2 ✓ (estimated — the global robotaxi market of ~$415B by 2035 is 340× the bar, the widest headroom in its batch). 17 points below the 65-point threshold — first score. No FLAG: deductions of 9. Watch: whether the gross margin keeps climbing from 37.5%, whether the cash decline forces a raise before 2028, and whether permits keep pace with the fleet.
Strengths
- Growth accelerating: Q2 +82% YoY and +103% QoQ, first half +73%, FY2025 +90%
- Overseas commercialisation: overseas revenue ~40% and +164% YoY, expanding across the Middle East, Europe and Asia-Pacific
- L2+/L3 explosion: +26× YoY, 30,000 units shipped in the quarter, a 100,000 cumulative target by year-end
- Margin improving: gross margin of 28.1% → 37.5% (+9.4pp), gross profit +143%
- Paid rides proven: 21 rides per vehicle per day on average, registered users +35% QoQ
Concerns
- Deep losses: the quarterly net loss is 1.7× revenue, with breakeven targeted for 2029
- Low margin: a 37.5% gross margin is a hardware-blend margin, with an operating margin near −190%
- Cash falling: RMB 7.1B → 5.4B in six months — a raise may be needed around 2028 if the decline continues
- Regulation and geopolitics: city-by-city permits, US–China data and listing risk
- Competition: Waymo, Apollo Go and Pony.ai in the same market, direct share unconfirmed
Research notes
Thesis: the speed is real — the economics are not yet proven
WeRide enters the BlitzLab record with a first scoring of 48 out of 100, grade C, built from Speed 20 out of 25, Moat 26 out of 60, Creative Destruction 11 out of 15, and deductions of 9. The total sits 17 points below the 65-point line, and the shape of the score is the story: speed converts to 80.0, among the highest in coverage, and creative destruction to 73.3, while the moat converts to only 43.3. This is the robotaxi and driver-assist company — trailing-twelve-month revenue of about RMB 830.8 million, roughly US$122 million — whose second quarter grew 82% year on year, whose L2+/L3 driver-assist shipments rose 26 times, and whose overseas revenue grew 164% to about 40% of the total. The gross margin improved 9.4 points to 37.5%. The operating margin is still near −190%, and the quarterly net loss is 1.7 times revenue: speed has not yet proven it becomes economics.
The gates: both pass — the market is 340 times the bar
Gate 1, two pieces of product-market-fit evidence for a growth company, passes on a confirmed basis. Revenue growth of 82% year on year and 103% quarter on quarter, paid rides averaging 21 per vehicle per day, and registered users up 35% quarter on quarter are direct evidence. Gate 2, a ten-year market ceiling at least ten times current revenue, passes as an estimate with the widest headroom in its batch: the global robotaxi market of about $415 billion by 2035 is 340 times the bar. The realisation speed — permits, safety — sits outside WeRide's control. The fourth quarter of 2026 has not been reported at T, and its reporting date is unconfirmed — it is not a company-confirmed date and must not be presented as one — and no outcome is anticipated here. That is the balance of the record at T: the fastest growth in autonomous driving, cash falling from RMB 7.1 billion to 5.4 billion in six months, and a breakeven target of 2029 that the cash must survive to reach.
What the business is: robotaxis, robobuses and driver-assist kits
WeRide builds autonomous driving and sells it two ways: as a service, through its L4 robotaxi, robobus and robosweeper fleets, and as a product, through L2+/L3 driver-assist systems fitted by carmakers. Second-quarter 2026 revenue was RMB 231.7 million: L4 revenue of RMB 125.2 million, up 47.3% year on year, and L2+/L3 revenue up 2,593.8% — twenty-six times — on about 30,000 units shipped in the quarter, with a cumulative target of 100,000 units by year-end. The operating proof is in the fleet: about 3,400 L4 vehicles, up 22% since April, more than 1,800 of them robotaxis, up 40%, running an average of 21 paid rides per vehicle per day, up 24% quarter on quarter, with a peak of 28, and registered users in China up 35% quarter on quarter while ride-hailing revenue rose 140% quarter on quarter. Overseas is the second axis: revenue from outside China was about 40% of the total in the quarter, up 164.4% year on year, through asset-light partnerships in the Middle East, Europe and Asia-Pacific. Management's steady-state guide is technology-service revenue of more than US$50,000 per vehicle per year — a management estimate, not a reported figure.
Why it scored 48: speed at the top of coverage, economics unproven
Speed is 20 out of 25, converting to 80.0, among the highest in coverage. Growth (A1, 9 of 10) is the strongest single item: revenue was RMB 401.8 million in fiscal 2023 and RMB 361.1 million in fiscal 2024, then RMB 684.6 million in fiscal 2025, up 89.6%, and the second quarter of 2026 grew 82.2% year on year and 103.1% quarter on quarter, with the first half up 73.3%. The withheld point is the small base — trailing revenue is about RMB 830.8 million, roughly US$122 million — and the weight of vehicle sales inside the growth. Capital speed (A2, 4 of 5) rests on cash and liquid resources of about RMB 5.4 billion at the end of June 2026, against a quarterly net loss of RMB 400.7 million — about thirteen quarters of cover — and funding capacity proven by the October 2024 IPO and the Hong Kong listing; the cash is falling, from RMB 7.1 billion at the end of 2025. Hiring (A3, 3 of 5) cannot be verified because the headcount is undisclosed, though operating expenses rose only 9% against revenue up 82%. Share momentum (A4, 4 of 5) is the fleet growth and the overseas mix. The moat is 26 out of 60 (43.3), the lowest of the six: network effects 6, distribution 7, market size 9 — the global robotaxi market of about $415 billion by 2035 on Goldman Sachs estimates — and gross margin 4, on a gross margin of 37.5% in the quarter, up 9.4 points from 28.1%, but an operating margin near negative 190%. Creative destruction is 11 out of 15: the displacement of human-driven taxis and buses (4), paid driverless rides entering commercial use (4) and the direction of per-vehicle cost (3).
The risks: permits and burn
The deductions total 9. Debt (D1, minus 3) is not disclosed borrowing but burn: the quarterly net loss of RMB 400.7 million is 1.7 times quarterly revenue of RMB 231.7 million, and management's own targets are a single cash-flow-positive quarter in 2028 and annual breakeven in 2029 — at least two more years of losses, with cash falling from RMB 7.1 billion to RMB 5.4 billion in six months. Revenue quality (D2, minus 2) reflects the annual report's flagging of revenue recognition as a key audit judgment — product and service revenue mix is complex — and the fact that much of the revenue is vehicle sales rather than repeat service revenue, with the twenty-six-fold L2+/L3 jump tied to carmaker shipment timing. Governance (D3, minus 1) is a conservative placeholder: WeRide is reported to have a dual-class structure with founder Tony Han in control, but the voting split was not verified in the sources reviewed. Regulation (D4, minus 3) is the structural exposure: every city's autonomous-driving permit is a separate dependency, and a delay or revocation stops revenue there; US–China geopolitics touches the listing and data rules for a Chinese company on Nasdaq; and one safety incident can halt a whole fleet. No investigation or suit was under way. Competition is the un-scored shadow: Waymo, Apollo Go and Pony.ai are in the same market, and WeRide's direct share is undisclosed.
What would change the score
The score's future turns on unit economics: disclosure of profit per vehicle would convert the growth story into an economics story, and the management guide of more than US$50,000 of technology-service revenue per vehicle per year is the number to test against. The dated milestones are the 2028 single-quarter cash-flow-positive target and the 2029 annual breakeven — either would retire the largest deduction. Permits are the second lever: each new city that opens to paid driverless operation widens the addressable market the score currently limits to permitted cities, and each revocation would do the opposite. The L2+/L3 line needs to show it is a business and not a shipment spike — sustained quarterly volumes toward the 100,000-unit cumulative target, rather than one twenty-six-fold quarter. Cash is the clock: if the decline from RMB 7.1 billion to 5.4 billion continues, a refinancing decision arrives before the 2029 breakeven, and its terms would themselves move the score.
More Frontier companies
Other Frontier names on the Blitz Index, highest score first: Rocket Lab (62/B), Tesla (62/B), Illumina, Inc. (61/B).
Next earnings
Nov 20, 2026 · Before open · Confirmed
Coverage
WeRide Inc. · Next earnings unconfirmed at scoring · Score 48 · Grade C
Embed this score
Copy the HTML below to show this score on your site. The badge links back to this page and updates automatically when the score changes.
Preview:
BlitzLab scores businesses against a scholar’s standard — not investment advice. No price targets, no buy/sell recommendations. Figures are from SEC filings (XBRL) as labeled in the source scorecard.