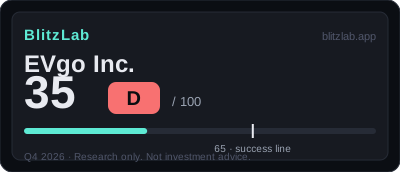
EVgo Inc. — Blitz Index 35 (D)
EVgo scores 35 — sixteen straight quarters of double-digit charging growth prove the core, while decelerating total revenue, policy-dependent capital, and a sales-process control weakness cap the score.
Last re-scored: October 27, 2026.
Confidence: Medium · Category: power
Score breakdown
| Section | Score | Detail |
|---|---|---|
| A · Speed | 13 / 25 | Charging network +19% YoY in Q2 2026 after 16 straight double-digit quarters — but total revenue fell −16% YoY and FY2026 guidance implies only +4–12% |
| B · Moat | 25 / 60 | 1.8M+ accounts, PlugShare, and GM/Pilot/Kroger site pipelines — but riders multi-home, NACS roaming lowers switching costs, and charging margin is still scaling |
| C · Creative destruction | 9 / 15 | Public fast charging displaces gas-station visits — but Tesla defines the category (51.6% of ports) and EVgo is the No. 3 challenger at 7.1% |
| D · BlitzFailing | −12 | DOE loan cut 40%, sales-process control weakness, LS Power 57% control, and policy exposure on both demand and capital — 3 points from the FLAG line |
Think we scored it wrong? Score it yourself →
Radar axes (0–100): Moat 41.7 · Speed 52.0 · Creative 60.0.
Watch item
Gates: G1 ✓ (core charging growth — 16 straight double-digit quarters, extended into Q1·Q2 2026) · G2 ✓ (narrow US public DC wedge; vendor estimates reach ~2.5× the $4.03B bar by 2030, thin cushion). 30 points below the threshold — first score. Demerits −12, three points from the FLAG threshold (15).
Strengths
- Charging network growth extends: 16 straight double-digit quarters through Q4 2025, plus +18% in Q1 and +19% in Q2 2026 — the core product's sustained growth is proven
- First annual adjusted EBITDA profit in FY2025 (+$12M) and charging margin widened from mid-teens to the high-30s percent on utilization leverage
- 5,380 stalls, 1,230+ sites, 47 states — plus GM 2,850, Pilot up to 2,000, and Kroger 150+ per year in the partner pipeline
- Liquidity headroom: DOE $409.0M undrawn + Voyager $153.4M undrawn + $197.7M cash — no near-term funding wall
- Tesla V4 agreement announced August 2026 — a cooperation structure with the category leader
Concerns
- Total revenue decelerated: Q2 2026 −16% YoY, FY2026 guidance only +4–12%, and H1 2026 adjusted EBITDA back to −$18.1M
- DOE facility cut 40% ($1.25B → $750M) with draw conditions and 1,594 stalls pledged — government-dependent capital, proven two-sided
- FY2025 audit found a sales-process internal-control weakness — no restatement, but remediation runs into FY2026 and beyond
- LS Power holds 57.0% of votes and controlled-company status — a structural minority discount, plus Up-C and tax-receivable burdens
- One unnamed customer at 21.8% of revenue and ~50% of charging revenue in California — single-customer, single-state concentration
Research notes
Latest quarter — Q2 2026
EVgo's second quarter of 2026 showed its charging network growing while total revenue fell, because non-charging lines shrank. Charging network revenue rose 19% to $61 million, its 18th consecutive quarter of double-digit growth, and throughput reached 99 gigawatt-hours. Total revenue fell 16% to $82.6 million, and the company kept its full-year guidance of $400 million to $430 million in revenue (company Q2 2026 release, GlobeNewswire).
Thesis: the core is blitzing; the total is not
EVgo Inc. (NASDAQ: EVGO) scores 35 out of 100 under BlitzLab v1.0, a grade of D, in its first scoring. The arithmetic is Speed 13 out of 25, Moat 25 out of 60, Creative Destruction 9 out of 15, and Demerits of minus 12, for a total of 13 plus 25 plus 9 minus 12 equals 35. That is 30 points short of the 65-point threshold, and the demerit total of 12 sits three points below the 15-point FLAG threshold — close, but not triggered. On the three-axis radar conversion, Moat stands at 41.7, Speed at 52.0, and Creative Destruction at 60.0, all on a 100-point scale.
Speed: charging grows double digits; the total wobbles
The charging network has grown double digits for 16 straight quarters through Q4 2025 on company reporting — Q3 2025 plus 33 percent, Q4 2025 plus 37 percent — and extended into Q1 2026 (plus 18 percent) and Q2 2026 (plus 19 percent). Throughput reached 366 GWh in FY2025 (plus 32 percent), stalls grew from 5,100 at year-end 2025 (plus 25 percent year over year) to 5,380 in Q2 2026 (plus 24 percent), and customer accounts passed 1.8 million. Total revenue tells a lumpier story: FY2023 161.0 million dollars, FY2024 256.8 million (plus 59.6 percent), FY2025 384 million (plus 50 percent), and a trailing twelve months of 402.9 million — but Q2 2026 total revenue fell 16 percent year over year as eXtend and ancillary one-offs faded, and FY2026 guidance of 400 to 430 million implies only 4 to 12 percent growth over FY2025. Speed scores 13 of 25: the core's sustained growth is proven, but deceleration and lumpiness cap it.
Capital is available but it is not blitz capital. A Department of Energy facility of 750 million dollars — cut 40 percent from 1.25 billion on April 29, 2026 — still has 409.0 million undrawn, a Voyager facility has 153.4 million undrawn, cash stands at 197.7 million, and 183.5 million of at-the-market capacity remains after zero sales in 2024 and 2025. The discounts are structural: DOE draws are condition-gated, the 40 percent cut is a policy and lender signal, and with a market capitalisation near 0.33 to 0.43 billion dollars on a press-reported basis, equity raises would be extremely dilutive. Capital velocity scores 3 of 5. Hiring-blitz evidence could not be established from official filings, and stalls per employee is only a proxy — hiring scores 2 of 5. Share velocity also scores 2 of 5: stalls grew 24 percent year over year and the company claims the No. 3 US DC fast-charging position, but third-party DC port share was flat at 7.1 percent from July 2025 to April 2026 against Tesla at 51.6 percent and Electrify America at 7.9 percent, and Tesla's network opening through NACS and Magic Dock raises competitive intensity. No relative share gain is proven.
Moat: distribution is real; lock-in is not
True network effects are weak: drivers multi-home, and roaming plus NACS interoperability lower switching costs. What exists is density plus discovery: 1.8 million-plus accounts (up 99,000 in Q2 2026), ownership of PlugShare for discovery and data, the EVgo Inside API (GM, Honda, Lyft, Presto, Toyota), and California density at roughly 46 to 50 percent of charging revenue. Network effects score 5 of 18 — below NBIS at 7, because the software stack's revenue contribution is undisclosed and there is no lock-in. Distribution scores 8 of 18: 1,230-plus sites across 47 states, with a partner pipeline that is substantive — GM 2,850 stalls (81.4 percent complete, deadline June 30, 2028), Pilot up to 2,000 stalls (about 1,300 complete, reported), Kroger 150-plus per year (to about 2035), Meijer up to 480, Brixmor 500-plus, Regency 400-plus (reported), and Tesla V4 planned for the second half of 2026. The discounts are friction: site licensing and grid-interconnection delays (the 10-K acknowledges past host terminations and GM grid delays), 2026 deployments weighted to the fourth quarter, and DOE draw conditions. Market size scores 7 of 12: the gate passes, but a US-only single vertical cannot match AI-infrastructure TAMs, and the vendor-estimate dependence is the same weakness as in the gate. Gross margin scores 5 of 12: trailing-twelve-month GAAP margin is about 19.3 percent (FY2025 21.0 percent, Q2 2026 8.9 percent — volatile), charging margin is about 35 percent and widened from the mid-teens to the high-30s percent, adjusted margin is about 30 percent (FY2024 29.5 percent, Q2 2026 31.8 percent), and adjusted EBITDA went from plus 12 million in FY2025 to minus 18.1 million in the first half of 2026. Direction right, level and stability short.
Creative destruction: displacing the gas-station visit, from third place
Public fast charging is part of the order that displaces the internal-combustion fueling visit, but Tesla defines the category at 51.6 percent of ports while EVgo is the third-place challenger at 7.1 percent, and the transition itself is driven by EV adoption and policy rather than by EVgo. Charging is 58.8 percent of trailing-twelve-month revenue on a calculated basis. Behaviour change scores 3 of 5: drivers and fleets are routinising public fast charging (throughput plus 32 percent in FY2025, 1.8 million-plus accounts, transport-network and autonomous-vehicle hubs), but home charging remains an alternative, drivers multi-home, US EV sales fell 36 percent year over year in Q4 2025 after the tax-credit sunset on a reported basis, and the GM and Pilot agreements are partner lock-in, not rider lock-in. Cost-structure change scores 3 of 5: utilisation leverage is proven — charging margin widened from the mid-teens to the high-30s percent as throughput per stall rose — and 350 kW flagships plus a Delta co-developed next-generation architecture aim at lower cost per kilowatt-hour, but throughput per stall was flat in 2026 (276 vs 281 kWh per day) and no structural collapse in energy or hardware cost is proven.
Deductions: policy on both sides of the ledger
Debt scores minus 4: total debt of 297.250 million dollars is 0.74 times trailing-twelve-month revenue, net debt is about 99.6 million on an estimated basis, 562.4 million remains undrawn, maturities run to 2042 (DOE) and 2030 (Voyager), and the record shows no distress — but coverage is thin with first-half 2026 adjusted EBITDA at minus 18.1 million, the 40 percent DOE cut is a policy and lender signal, 1,594 stalls are pledged, and total debt of 657.3 million stands against total assets of 966.9 million. Revenue quality scores minus 3: no restatement and no auditor change were found, but the FY2025 audit found a material weakness in internal control over the retail, commercial, OEM charging and eXtend revenue processes (no material misstatement claimed; remediation may run past FY2026), quarterly one-offs flattered results (a 25.9 million dollar ancillary termination fee in Q4 2025, about 22 percent of that quarter's revenue, reported; a first-quarter 2026 autonomous-vehicle hub sale gain, reported), and one unnamed customer is 21.8 percent of revenue. Not fraud — a quality discount. Governance scores minus 2: LS Power holds 57.0 percent of votes (Class A 5.9 million shares plus all Class B 172.8 million shares, March 19, 2026 record date), Nasdaq controlled-company status exempts the company from majority-independent-board and fully-independent-committee requirements, and the Up-C structure plus tax-receivable agreement carry substantial, potentially accelerable payments. Mitigants: one share one vote (not dual-class), LS Power's share falling from 66.5 percent in December 2024 to 57.0 percent, and no founder-control issue. Regulatory and social cost scores minus 3: policy is the first variable on both demand and capital — the 7,500 dollar EV tax credit ended after September 30, 2025 and the 30C credit after June 30, 2026 under the One Big Beautiful Bill Act (the company judges no material impact), California's ACC II was repealed in 2025 via the Congressional Review Act, NEVI was halted then re-guided (the company judges limited impact), and the DOE loan itself is policy-dependent, as the cut proves. California is about 50 percent of charging revenue, with outage, earthquake and hurricane exposure. No material litigation or fines were found.
Blitzscaling fit: a policy-fuelled blitz
EVgo's main levers are distribution (sites and partners) and capital (government loans) — a heavy-asset blitz with smaller, dispersed units than the power and capacity blitzes of NBIS or CRWV. The secondary lever is platform: PlugShare plus the EVgo Inside API plus Autocharge-plus, wrapped around discovery, payment and fleet connections, with revenue contribution undisclosed. The weak lever is network effects: multi-homing plus NACS interoperability keep lock-in low, and density is concentrated in California. Speed was bought with government money — a DOE loan with a 17-year maturity and capitalised interest during deployment — and partner money, with GM and Pilot bearing sites and assets while EVgo operates them, in exchange for termination, milestone and liability clauses. Efficiency comes from utilisation, not price: charging margin widened on rising throughput per stall, and 2026's flat throughput per stall exposes that formula's weak point. EVgo is in a decelerating first blitz: FY2023 161 million, FY2024 257 million, FY2025 384 million, then FY2026 guidance of 400 to 430 million. With demerits at 12, it is a near FLAG watch — any D item worsening by 3 points triggers the flag. The single largest risk is that the valve is in someone else's hands: DOE draw conditions and cuts, credit sunsets, California regulation and NEVI guidance all tie EVgo's speed, capital and demand to policy decisions, and one more valve closing would slow stalls, throughput and margin at once.
What to watch
The nearest trigger is Q3 2026 earnings, date still unconfirmed: does double-digit charging growth hold, and where does adjusted EBITDA go? Then: further DOE draws or condition changes (a further cut reopens D1), remediation of the sales-process control weakness (FY2026 audit), the first Tesla V4 sites (a distribution and competition shift), GM's 2,850-stall milestone progress (deadline June 30, 2028), LS Power's stake (below 50 percent reopens governance), the unnamed customer's share (21.8 percent baseline), and the FLAG line at minus 15 (currently minus 12).
The charging network is the growth engine. Charging network revenue reached about $61 million in the second quarter of 2026, up 19% year over year and the 18th consecutive quarter of double-digit growth (company Q2 2026 release, GlobeNewswire). Network throughput was 99 gigawatt-hours, up 13% year over year and 9% sequentially, with trailing-twelve-month throughput of 384 gigawatt-hours, up 16%. The company operated 5,380 stalls at quarter end, up 24%, after adding 280 stalls, including 120 company-owned public stalls, and retiring 175 older chargers. Customer accounts exceeded 1.8 million after more than 99,000 new accounts in the quarter. The quarter's operating numbers describe the network's scale.
Total revenue tells a different story from the network alone. Total revenue was $82.6 million, down 16% from $98.0 million a year earlier, because eXtend revenue fell to $18 million, down $19 million on lower equipment sales and construction revenue, alongside a pullback in non-charging business (company Q2 2026 release, GlobeNewswire). First-half total revenue was $192.2 million, up 11%. Charging network gross profit rose 15% to $22 million, a 36% margin against 37% a year earlier, while total gross profit fell 47% to $7.3 million, an 8.9% margin against 14.2%. Adjusted gross profit was $26.3 million, down 7%, at a 31.8% margin, up 290 basis points. The net loss widened to $46.3 million from $29.8 million, and adjusted EBITDA was negative $10.6 million against negative $1.9 million, which the company said was in line with its guidance.
The quarter's strategic centerpiece is Tesla charging. Under an agreement announced with the results, EVgo will deploy EVgo-owned and branded Tesla V4 Superchargers, capable of up to 500 kilowatts and 1,000 volts, with Magic Dock and Tesla navigation integration, at up to 20 stalls per site, starting in 2026 (company Q2 2026 release, GlobeNewswire). The company operated 240 NACS connectors at quarter end and aims for about 500 by year end, with more than 3 million Tesla vehicles in the United States as potential users. The first EVgo Supercharger site opened on November 5, 2026, near downtown Chicago, with 12 stalls, as the first of the first few dozen sites in the nationwide rollout (company announcement, GlobeNewswire). Grocery-anchored retail sites are the first stage for the V4 rollout, with partnerships already in place at Meijer, Kroger, and Regency Centers.
Retail and highway partnerships frame the build-out. In August 2026, EVgo opened a flagship station in Warren, Michigan, with Meijer and General Motors, offering 12 CCS and NACS stalls at up to 350 kilowatts and pull-through lanes for vehicles towing trailers (company announcement, GlobeNewswire). That brought the count of flagship stalls past 40, with a target of more than 100 by the end of 2026. The General Motors, Pilot, and EVgo highway network passed 300 locations and 1,300 stalls across 40 states (reported, citing company announcements). EVgo also expanded its Brixmor Property Group partnership by more than 500 stalls across at least 90 sites and its Regency Centers partnership by more than 400 stalls (reported; company announcement, GlobeNewswire). In September 2026, the company previewed a next-generation charging system of up to 750 kilowatts, developed with Delta Electronics, using dynamic power sharing, with deployment planned for 2027 (company announcement, GlobeNewswire).
The full-year plan concentrates the work in the fourth quarter. Guidance updated on August 5, 2026, calls for total revenue of $400 million to $430 million, adjusted EBITDA of negative $25 million to negative $5 million, 1,350 to 1,625 new stalls, eXtend revenue of $90 million to $95 million, autonomous-vehicle and ancillary revenue of $40 million to $45 million, and adjusted G&A expense of $148 million to $152 million (company Q2 2026 release, GlobeNewswire). The company expects adjusted EBITDA to be negative in the third quarter and positive in the fourth, with about 60% of 2026 construction concentrated in the fourth quarter. Liquidity was about $835 million, including more than $630 million available from Department of Energy and commercial facilities. Third-quarter 2026 results are due on November 9, 2026, as confirmed by the company on October 30, 2026, and no third-quarter figures exist yet.
More Power & Energy companies
Other Power & Energy names on the Blitz Index, highest score first: Solaris Energy Infrastructure (59/C), Bloom Energy (58/C), Forgent Power Solutions (50/C).
Next earnings
Q4 2026 · Expected
Coverage
EVgo Inc. · Q3 2026 due Nov 9, 2026 (BMO, confirmed) · Score 35 · Grade D
Embed this score
Copy the HTML below to show this score on your site. The badge links back to this page and updates automatically when the score changes.
Preview:
BlitzLab scores businesses against a scholar’s standard — not investment advice. No price targets, no buy/sell recommendations. Figures are from SEC filings (XBRL) as labeled in the source scorecard.