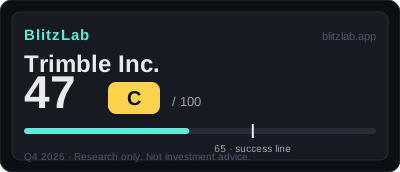
Trimble Inc. — Blitz Index 47 (C)
Trimble scores 47 — a mature industrial-technology company whose subscription conversion is real and whose reported growth is masked by divestitures, held back by single-digit organic growth and an unremediated internal-control weakness.
Last re-scored: November 6, 2026.
Confidence: Medium · Category: platforms
Score breakdown
| Section | Score | Detail |
|---|---|---|
| A · Speed | 14 / 25 | Reported revenue fell FY2023 $3,798.7M → FY2025 $3,587.3M on divestitures, but organic growth was +6% in FY2025 and +7% in Q3 2026, with ARR $2.56B (+11% YoY, a record high) |
| B · Moat | 29 / 60 | Subscription and services reached 68.3% of revenue with 79% recurring revenue and a 69.1% gross margin, but network effects are weak (B1 6) and distribution is enterprise sales plus a dealer network, not viral |
| C · Creative destruction | 11 / 15 | Digital, connected and automated workflows are displacing paper drawings, manual surveying and phone-based dispatch across construction, geospatial and transportation — a broad, largely irreversible industry shift in which Trimble is a leading participant, not the sole driver |
| D · BlitzFailing | −7 | An active, unremediated material weakness in internal control over financial reporting (D2 −3) plus total borrowings of $1,533.5M against $214.5M of cash (D1 −3) and a minor regulatory-history deduction (D4 −1) |
Think we scored it wrong? Score it yourself →
Radar axes (0–100): Moat 48.3 · Speed 56.0 · Creative 73.3.
Watch item
Gates: G1 ✓ (confirmed — growth sustained on an organic basis, plus a second growth curve in software and subscription) · G2 ✓ (estimate — segment-market sum of ~$73.0B today vs a ~$38.5B bar; narrow definitions alone fall short of the bar). 18 points below the threshold — first score. Watch: whether the material weakness in internal control is remediated, whether organic growth re-accelerates toward the FY2026 guidance of +9–10%, and whether ARR growth of +11% converts into reported revenue growth once divestiture effects wash out.
Strengths
- Underlying growth continues: organic +6% in FY2025, +7% in Q3 2026, ARR $2.56B up 11% YoY to a record high, and FY2026 revenue guidance of $3,910–3,940M (+9–10%)
- Subscription conversion: subscription and services rose to 68.3% of revenue from 53.4% in FY2023, with recurring revenue at 79% of FY2025 revenue and gross margin of 69.1%
- Profitable cash generation: operating cash flow of $664.7M in the first nine months of 2026, free cash flow of $643.6M, and $552.9M of share repurchases in the same period
- A large addressable market: segment markets sum to ~$73.0B today and ~$151.0B by 2030, roughly twice the G2 bar
- Highly profitable segments: AECO operating margin of 34.2% and Field Systems of 31.1% in FY2025
Concerns
- Growth deceleration and falling reported revenue: reported revenue declined for two consecutive years and organic growth is single-digit (+6–7%)
- Active material weakness in internal control (unremediated): adverse auditor opinion, disclosure controls judged "not effective" as of 2026-10-02, with a history of delayed filings and a Nasdaq notice (D2 −3)
- Growing more slowly than its markets: organic growth of +6–7% versus market CAGRs of 11–17%, with no demonstrated share gain (A4 2)
- Debt: total borrowings of $1,533.5M, net borrowings of $1,319.0M, and a debt-to-equity ratio of 71.5% (D1 −3)
- Goodwill impairment of $562.0M in Q2 2026 (T&L reporting unit, non-cash) — a nine-month GAAP net loss of −$313.7M and FY2026 GAAP EPS guidance of a loss
Research notes
Thesis: a mature converter, not a blitz scaler
Trimble Inc. (Nasdaq: TRMB) earns a BlitzLab v1.0 score of 47 out of 100, grade C, eighteen points below the 65-point threshold. The shape of the score matters more than the total: speed 14 of 25, moat 29 of 60, creative destruction 11 of 15, and deductions of 7 points. Converted to the radar's hundred-point axes, that reads as moat 48.3, speed 56.0, and creative destruction 73.3. Both gates pass. G1, sustained growth or a second growth curve, passes on confirmed evidence. G2, a ten-year market ceiling at least ten times current revenue, passes as an estimate — and the estimate carries an openly stated sensitivity, because on narrow market definitions alone the conclusion would change. No FLAG applies, because deductions of 7 fall well short of the 15-point FLAG line, with eight points of headroom. The story the score tells is consistent from every angle: a mature industrial-technology company, founded in 1978 and listed since 1990, that is converting itself from hardware into software and subscription revenue, profitably and with real cash generation, but at single-digit organic growth rates and with a live question mark over the reliability of its own financial reporting.
This is the first BlitzLab score for Trimble, and the first scored company from the construction, geospatial and transportation software vertical. The scoring date, T, is 6 November 2026, and the latest results in scope are the third quarter of 2026, reported on 4 November 2026. Fourth-quarter 2026 results are unannounced at T and are excluded from this score; they appear only as a future marker, with no outcome anticipated. Confidence is rated medium-high for SEC figures, which rest on the 10-K and 10-Q texts reviewed directly with XBRL cross-checks, and lower for market structure, where the total addressable market rests on independent market-research estimates. Where the score file is silent, this article is silent too: the voting structure is not disclosed in the material reviewed, and share price and market capitalisation are not disclosed in the scoring pack, so no valuation ratio is computed and no price-based claim appears here. The score is a judgement of the business, not of its price.
The single most important thing to understand about Trimble's numbers is that the revenue line, read naively, says the opposite of what the business is doing. Reported revenue fell from $3,798.7 million in fiscal 2023 to $3,683.3 million in fiscal 2024, down 3.0 percent, and then to $3,587.3 million in fiscal 2025, down 2.6 percent. Two consecutive years of decline would normally read as a company shrinking. Here it is, to a large extent, a company deliberately getting smaller on paper: the agriculture business was sold into a joint venture in the second quarter of 2024, and the Mobility business was sold on 8 February 2025. Both divestitures remain in continuing operations rather than being shown as discontinued operations, so a large part of the reported decline is divestiture effect, not lost customers or lost demand. Any reading of Trimble that starts and ends with the reported revenue line will get the company wrong, and the score file's first analytical act is to separate the two.
Speed: the underlying business grows; the headline does not
Growth, item A1, scores 5 of 10, and the score is a compromise between two true statements. On an organic basis, growth continues: fiscal 2025 organic revenue rose 6 percent, with products down 1 percent and subscription and services up 9 percent; the third quarter of 2026 grew 7.3 percent year on year, 7 percent organically; the first nine months of 2026 reached $2,878.7 million, up 10.0 percent year on year; and annualised recurring revenue reached $2.56 billion, up 11 percent year on year and 10 percent organically, a record high. Fiscal 2026 revenue guidance of $3,910 million to $3,940 million implies growth of 9 to 10 percent over fiscal 2025, which would be a step up from the organic pace if achieved. The strongest single signal in the whole score is that ARR figure: recurring revenue growing at 11 percent while the reported top line shrinks is the clearest evidence that the conversion to subscription is working. But the ceiling on the score is equally clear. The absolute level of organic growth is single-digit, 6 to 7 percent, and the reported decline caps what can be claimed. A growth score of 5 says: real, durable, and too slow to be a blitz.
Capital velocity, item A2, scores 4 of 5. Trimble does not need external capital to grow: it is a self-funding structure. Operating cash flow in the first nine months of 2026 was $664.7 million, free cash flow on the company's definition was $643.6 million, and share repurchases in the same nine months were $552.9 million. Cash stood at $214.5 million. Capital is not the bottleneck. The point withheld is about what the cash is doing: this is not the external fundraising of a blitz, but self-generated cash flow plus buybacks — a harvest mode, in the mature-company convention the score file applies. There is also a caution inside the cash-flow surge itself: the nine-month operating cash flow figure reflects a $562.0 million goodwill impairment, a non-cash add-back, and a $235.9 million decrease in accounts receivable, so part of the cash generation in the period reflects one-off factors rather than a pure acceleration of underlying cash earnings. The score gives 4 for a company whose capital position is strong but whose use of capital is consolidation, not expansion at blitz speed.
Hiring and productivity, item A3, scores 3 of 5, and the score is as much about evidence as about performance. Revenue per employee works out to approximately $335,000 on trailing-twelve-month revenue of $3,848.5 million divided by more than 11,500 employees, a mid-range level for a mixed hardware and services industrial-technology company. But the denominator is stale: the headcount figure is as of the end of 2025, roughly ten months old at T, and the third-quarter 10-Q discloses no updated headcount, so the pace of hiring — a hiring blitz — cannot be demonstrated from the filings. Productivity is middling and expansion speed is unconfirmed, and 3 points price exactly that combination.
Share velocity, item A4, scores 2 of 5, the weakest speed item, and the reasoning is comparative. The 10-K discloses no quantified market share, so the file infers from growth rates, and the inference is unfavourable: Trimble's organic revenue growth of 6 to 7 percent sits below the growth rates of its principal markets — geospatial intelligence at a compound annual growth rate of 11.1 percent, transportation management systems at 17.5 percent, and construction software at 15.11 percent. A company growing more slowly than its markets is, by definition, not demonstrating share gains. ARR growth of 11 percent comes close to market growth rates, but on a revenue basis the company trails. With no direct market-share figure to contradict the indirect evidence, the score file awards 2, and this article does not dress that up as something else. This is the item where the gap between Trimble's growth and its markets' growth is most visible, and it is the cleanest statement of why the speed section totals only 14 of 25.
Moat: subscription conversion is the moat; network effects are not
Network effects, item B1, score 6 of 18, because the file finds a data and ecosystem effect that exists but is weak. The Connect & Scale strategy — two open industry cloud platforms, one for construction and one for transportation and logistics, plus a common data environment — connects office and field workers' workflows, and positioning, construction-model and logistics data accumulate on the platform. Transporeon, the logistics platform, connects shippers and carriers as a two-sided marketplace, but it is only part of transportation and logistics, which is 15.3 percent of revenue. The whole is not a platform lock-in of the CUDA or iOS kind, nor a two-sided liquidity moat of the Uber kind; it sits in the middle of the data-and-ecosystem band, and customer switching costs are moderate — data migration, retraining and integration — so lock-in is weak. The score of 6 is a precise statement: the network effect is real, and it is not the moat.
Distribution scalability, item B2, scores 7 of 18. The motion is a hybrid: direct sales plus a dealer network — AECO BuildingPoint, and Field Systems dealers SITECH and Trimble Technology — plus expanding digital channels. The dealer network extends reach and is a genuine leverage point, and the score places the item at the top of the 5-to-9 band for distribution that is paid-for but repeatably expandable. The ceiling is structural: the core motion is enterprise selling to asset owners, construction companies and governments — high-cost, long-cycle — not viral, and digital channels are growing but are not yet the main motion. Distribution is not the product here, and 7 points say so.
Market size, item B3, scores 8 of 12, and the reasoning doubles as the G2 gate verdict. The gate passes as an estimate, on a definition declared before scoring: revenue is taken as total GAAP revenue, which needs no normalisation for Trimble because there is no large pass-through cost of the kind that distorts some other companies' top lines, and the divestiture distortion is already reflected in the trailing-twelve-month figure. The bar is trailing-twelve-month revenue of $3,848.5 million times ten, approximately $38.5 billion — $35.9 billion on a fiscal 2025 basis. Trimble's addressable market is defined as the sum of the three segment markets in which it actually competes: construction software on the broad definition, from TechSci Research, at $20.02 billion in 2024 rising to $46.57 billion in 2030 at a 15.11 percent compound annual growth rate; geospatial intelligence, from MarketsandMarkets, at $37.13 billion in 2025 rising to $62.88 billion in 2030 at 11.1 percent; and transportation management systems, from Grand View Research, at $15.88 billion in 2024 rising to $41.57 billion in 2030 at 17.5 percent. The sum is approximately $73.0 billion today, 1.9 times the bar, and approximately $151.0 billion by 2030, 3.9 times the bar, and on a ten-year horizon to 2036 the sum exceeds $300 billion at those growth rates. Even a single market on its own comes close: geospatial intelligence at $37.13 billion rising to $62.88 billion approaches the bar today and clears it by 2030. Trimble's trailing-twelve-month revenue is about 5.3 percent of the roughly $73 billion market, so the remaining room is large. Full marks are withheld because the absolute market size is in the tens of billions, not the hundreds of billions of AI infrastructure, and because of the sensitivity described next.
The sensitivity must be stated plainly, because the score file states it plainly. On narrow definitions alone, the conclusion changes. Construction management software on the narrow definition is $2.2 billion to $3.9 billion, precision agriculture is $12 billion to $14 billion, and transportation management systems are about $15 billion; their simple sum is around $30 billion, below the bar of $38.5 billion. Two qualifications belong with that arithmetic. First, precision agriculture is a market Trimble has reduced its direct exposure to by selling the agriculture business, so excluding it from the addressable market is the correct treatment. Second, construction management software on the narrow definition is narrower than Trimble's actual business, which spans the design, modelling, engineering and asset-operation work of the AECO segment. The segment-level definition — broad construction software plus geospatial intelligence plus transportation management systems — matches the business Trimble actually runs, and on that definition the bar is cleared comfortably. Broader definitions still, such as geospatial solutions at $505 billion or GNSS at more than 300 billion euros, were not used, because consumer and automotive volumes dominate them and they are not Trimble's addressable market. G2 therefore passes, but it passes on the segment-level definition, and the file records that dependence as a sensitivity rather than hiding it.
Gross margin, item B4, scores 8 of 12, and it is the strongest moat item. The gross margin is high and stable: 69.1 percent in fiscal 2025, or $2,477.9 million, and 68.2 percent in the third quarter of 2026, or $659.1 million. The subscription and services mix supports it — that share rose from 53.4 percent of revenue in fiscal 2023 to 68.3 percent in fiscal 2025, with recurring revenue at 79 percent of fiscal 2025 revenue — and the operating picture is consistent: non-GAAP operating margin of 27.2 percent in the third quarter and adjusted EBITDA margin of 28.8 percent. What keeps the score at 8 rather than higher is trajectory: the margin is not expanding but edging down, with the third-quarter gross margin moving from 68.9 percent to 68.2 percent year on year and the non-GAAP operating margin from 28.2 percent to 27.2 percent. There is no simultaneous signature of acceleration plus margin expansion. The margin level is high; the trajectory is flat.
Creative destruction: displacing the paper-and-phone order
Creative destruction totals 11 of 15, the strongest section, and its three items trace a single arc. The order being displaced, item C1, scores 4 of 5. The old order is paper drawings, manual surveying and phone- or fax-based dispatch across construction, surveying and logistics, and the displacement is digital, connected and automated solutions. The displaced order is clear and large — the construction, geospatial and transportation industries as a whole. The point withheld is for leadership: the transition is being driven by the whole industry, including Autodesk, Esri and Oracle, and Trimble is one leading participant among several, not the company driving the change alone.
Irreversible behaviour change, item C2, also scores 4 of 5. The change is largely irreversible: a construction company that has adopted building information modelling and digital construction has no reason to return to paper drawings; a surveyor using GNSS positioning does not go back to manual methods; a logistics company using a transportation management system does not return to phone dispatch. ARR of $2.56 billion, up 11 percent, is the measurable spread of that behaviour change. The point withheld is the same as in C1: Trimble did not create the behaviour change; it is an industry-wide digital transition, and Trimble is riding it rather than originating it.
Cost-structure change, item C3, scores 3 of 5. Customers' costs do fall: less construction rework and shorter schedules, faster and more accurate surveying, optimised routes and less empty mileage in logistics. Trimble's own high gross margin of 69.1 percent shows it captures value from that saving. But there is no demonstration of a collapse in the industry's cost structure itself — Trimble's margin is edging down rather than expanding — so customer cost reduction is real without being structural collapse. Three points say exactly that. Taken together, the creative-destruction section is the one part of the score where Trimble looks like a blitzscaling company: the old order is large, the displacement is real, and the behaviour change is hard to reverse. The reason the total is 47 rather than 65 is that the company displacing the order is growing at 6 to 7 percent organically and holds a moat of 29 out of 60.
Deductions and risks: the control weakness is the largest discount
Deductions total negative 7, and their composition is the most instructive part of the score. Debt, item D1, takes negative 3. Total borrowings are $1,533.5 million — short-term borrowings of $90.2 million plus long-term borrowings of $1,443.3 million — against cash of $214.5 million, giving net borrowings of $1,319.0 million. Total assets are $8,535.1 million and equity is $4,975.8 million, a debt-to-equity ratio of 71.5 percent. The borrowings are centred on senior notes — 4.90 percent notes due 2028 of $600.0 million and 6.10 percent notes due 2033 of $800.0 million — plus a $50.0 million draw on the revolving facility. Operating cash flow of $664.7 million in nine months, annualised at roughly $886 million, can cover the debt, and net borrowings are 0.34 times trailing-twelve-month revenue and 26.5 percent of equity, so this is not distress. It is also not negligible, and negative 3 prices a real but manageable burden.
Revenue quality, item D2, also takes negative 3, and it is the single largest discount in the score, tied with debt. There is an active, unremediated material weakness in internal control over financial reporting. The history is specific and documented. A material weakness in business-combination accounting was identified in the fiscal 2023 closing process, and further weaknesses were found afterwards. The first three quarters of 2024 saw delayed 10-Q filings, and the company received a Nasdaq listing-rule 5250(c)(1) non-compliance notice. A 10-K/A was filed on 16 January 2025 and the delayed 10-Qs were filed, and the fiscal 2024 10-K on 25 April 2025 restored compliance. Form S-3 was unavailable for twelve months, ending in April 2026. The auditor, EY, issued an adverse opinion on internal control, concluding that as of 2 January 2026 the company had not maintained effective internal control over financial reporting. And the position at T is unchanged: in the third-quarter 2026 10-Q, Item 4, the chief executive and chief financial officer concluded that disclosure controls and procedures were not effective as of 2 October 2026, because of the material weakness reported in the fiscal 2025 10-K, with remediation in progress but not complete — a weakness is not treated as remediated until the remediated controls have operated and been tested for a sufficient period. There has been no restatement of the financial statements themselves, and no single customer exceeded 10 percent of revenue in fiscal 2023 through 2025. The deduction follows the EVGO precedent, where an active internal-control weakness also drew negative 3. The point is fundamental rather than technical: if internal control is not effective, the numbers themselves rest on a shaken premise, and blitzscaling's rules assume the numbers can be trusted.
Governance, item D3, takes no deduction. No governance discount factor was identified in the material reviewed, and the voting structure is not disclosed in the scoring pack, so no governance claim is made either way. Regulatory and social cost, item D4, takes negative 1, the lightest deduction. There is no material litigation in the 10-K's Item 3 or in the third-quarter 2026 10-Q, and no securities class action, SEC investigation or regulatory action in the last twelve months was identified in the EDGAR filing scan — with the caveat that a full search of court and SEC enforcement records outside EDGAR is unconfirmed, and no data breach was reported. The single point rests on regulatory history: the 2024 Nasdaq non-compliance notice arising from the delayed filings, with compliance restored on 25 April 2025. It is an active investigation or enforcement matter it is not; it is a record of a past lapse, and the file deliberately keeps the deduction minimal to avoid double-counting the same facts already charged under D2.
Two further facts from the score file belong in the risk picture even though they are not separate deduction items. First, the transportation and logistics segment shrank after the Mobility divestiture, from $788.8 million in fiscal 2024 to $549.2 million in fiscal 2025, so the segment that carries the Transporeon platform is smaller than it was. Second, the second quarter of 2026 brought a goodwill impairment of $562.0 million in the transportation and logistics reporting unit, non-cash but large: the first nine months of 2026 show a GAAP net loss of $313.7 million, and fiscal 2026 GAAP earnings-per-share guidance is a loss. The impairment is a non-cash charge, and the company remains cash-generative, but it is a statement that part of what was bought in the past is worth less than was paid for it, and it sits in the same segment whose divestiture reshaped the revenue line.
Blitzscaling fit: the efficient converter
In blitzscaling terms, Trimble is a product-plus-distribution company, not a network-effects company. The main levers are product — the software and subscription conversion, with subscription and services at 68.3 percent of revenue and recurring revenue at 79 percent — and distribution through the dealer network. It belongs to the converter family of blitzers, though its assets are software and relationships rather than physical infrastructure, so the conversion is lighter. The secondary lever is platform: Connect & Scale, the two open industry cloud platforms plus the common data environment, points toward connection, but it is not yet the main revenue driver. The weak lever is network effects, which is why B1 sits at 6. The speed-versus-efficiency trade-off has been resolved in favour of efficiency: Trimble holds a non-GAAP operating margin of 27.2 percent, an adjusted EBITDA margin of 28.8 percent, and operating cash flow of $664.7 million in nine months, while growing organically at 6 to 7 percent. That is the opposite of the classic blitz, which sacrifices profitability for speed, and it is explained by maturity: at $3.85 billion of trailing-twelve-month revenue, Trimble is in the mature stage, and the price of protecting profitability has been deceleration. The score file's own label for the company is the efficient converter — a company that chose the mature firm's efficient conversion over blitz speed, and whose score structure, speed 56.0 against moat 48.3 against creative destruction 73.3, shows exactly that choice.
The stage assessment follows. The first blitz is long over; what is in progress now is a second blitz, the conversion to software and subscription, with ARR growing 11 percent as its signal. The BlitzFailing watch is not triggered: deductions of 7 sit eight points below the 15-point FLAG line, and unless the D items deteriorate sharply the FLAG is unlikely to fire. The exception is the control weakness: if it is not remediated and instead worsens — a further weakness found, or a refiling — D2 could deteriorate further. The largest single risk in the file's blitzscaling analysis is stated as a sentence: if internal control fails, the numbers cannot be trusted. Blitzscaling's nine rules assume the numbers can be trusted, and Trimble's numbers carry that shaken premise until remediation is complete and tested.
What to watch: three questions for the next quarter
Three watch items will decide the next scoring, and they are all visible in the file's own logic. First, the internal-control weakness: whether remediation completes and the auditor's adverse opinion and the not-effective disclosure-controls conclusion are reversed, or whether a further weakness or a refiling appears. Until the remediated controls have operated and been tested for a sufficient period, the weakness remains open and the largest discount in the score stays in place. Second, the growth trajectory: whether organic growth re-accelerates toward the fiscal 2026 guidance of 9 to 10 percent, and whether ARR growth of 11 percent converts into reported revenue growth now that the divestiture effects are washing out of the comparison. The guidance is the test of the second growth curve, and the next report will show whether the organic pace of 6 to 7 percent was a floor or a ceiling. Third, the market-share question: whether Trimble's growth begins to match or exceed the 11 to 17 percent compound growth rates of its principal markets, which is the only way the share-velocity item can rise from 2. Alongside those, the segment picture matters: AECO at a 34.2 percent operating margin and Field Systems at 31.1 percent in fiscal 2025 show where the profitability sits, and the transportation and logistics segment, smaller after the Mobility sale and carrying the $562.0 million goodwill impairment, is where the conversion story is most fragile.
One calendar marker belongs here, and only as a marker. The fourth quarter of 2026 has not been reported at T, and its reporting date is unconfirmed — it is not a company-confirmed date and must not be presented as one — and no outcome is anticipated here. That is the balance of the record at T: a real conversion to subscription, with ARR at a record high of $2.56 billion and recurring revenue at 79 percent; a genuinely large addressable market on the segment-level definition, with the honest caveat that narrow definitions alone would not clear the gate; profitable cash generation of $664.7 million in nine months; and, set against all of it, single-digit organic growth that trails its markets and an internal-control weakness that remains unremediated. The score of 47 does not say the conversion is failing. It says the conversion is real, profitable, slow — and, until the controls are fixed, resting on numbers whose reliability is formally in question.
More Platforms companies
Other Platforms names on the Blitz Index, highest score first: Alphabet (83/A), Meta (78/B), Airbnb (76/B).
Next earnings
Q4 2026 · Expected
Coverage
Trimble Inc. · Next earnings unconfirmed at scoring · Score 47 · Grade C
Embed this score
Copy the HTML below to show this score on your site. The badge links back to this page and updates automatically when the score changes.
Preview:
BlitzLab scores businesses against a scholar’s standard — not investment advice. No price targets, no buy/sell recommendations. Figures are from SEC filings (XBRL) as labeled in the source scorecard.