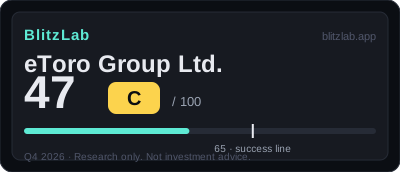
eToro Group Ltd. — Blitz Index 47 (C)
eToro scores 47 — social trading with 4.28M funded accounts and a 34% EBITDA margin, held back by 9% growth and deductions of 8 that are nearly all regulation and crypto volatility.
Last re-scored: August 11, 2026.
Confidence: Medium · Category: platforms
Score breakdown
| Section | Score | Detail |
|---|---|---|
| A · Speed | 16 / 25 | Net contribution +9% YoY with funded accounts up 18% to 4.28M — stable mature growth, not blitz speed, and contribution per account is falling |
| B · Moat | 31 / 60 | A social network (B1 8) with viral distribution (B2 8) and a 34% adjusted EBITDA margin (B4 8) — a real moat, built on copy trading |
| C · Creative destruction | 8 / 15 | Social and copy trading displacing parts of retail brokerage behaviour — a partial displacement, with institutional markets untouched |
| D · BlitzFailing | −8 | Crypto, CFD and copy-trading regulation across jurisdictions (D4 −4); crypto-driven volatility in net contribution (D2 −3); governance details unconfirmed (D3 −1) |
Think we scored it wrong? Score it yourself →
Radar axes (0–100): Moat 51.7 · Speed 64.0 · Creative 53.3.
Watch item
Gates: G1 ✓ (confirmed — growth sustained: funded accounts +18% to 4.28M, plus a second curve in the TradeZero acquisition) · G2 ✓ (estimated — on net contribution of ~$0.92B TTM; on gross revenue the bar would be distorted past $90B by crypto pass-through). 18 points below the 65-point threshold — first score. No FLAG: deductions of 8. Watch: Q3 results (2026-11-10, after T), whether net contribution re-accelerates, and whether regulation moves on crypto, CFDs or copy trading.
Strengths
- Social network is real: CopyTrader's two-sided network, funded accounts +18% to 4.28M
- Profitable and net cash: net income of $53M (+77%), cash of $1.2B, borrowings of $0
- High margin: adjusted EBITDA of $78M (34% of net contribution)
- US expansion: the TradeZero acquisition (TTM ~$80M, gross margin above 80%)
- Assets under administration up 10% ($19.2B), equities trading active
Concerns
- Slow growth: net contribution +9% YoY, contribution per account falling
- Crypto dependence: net-contribution volatility, derivatives revenue swinging quarter to quarter
- Structural regulatory risk: crypto, CFD and copy trading are all regulatory targets (D4 −4)
- Narrow displacement: only parts of retail behaviour replaced, institutional markets untouched
- Part of TTM net contribution is estimated — Q3 results (2026-11-10, after T) require recalculation
Research notes
Thesis: a real network, growing at a mature pace
eToro Group enters the BlitzLab record with a first scoring of 47 out of 100, grade C, built from Speed 16 out of 25, Moat 31 out of 60, Creative Destruction 8 out of 15, and deductions of 8. The total sits 18 points below the 65-point line, and the shape of the score is the story: speed converts to 64.0 and the moat to 51.7, while creative destruction converts to 53.3 — the only company in its batch where speed runs below the moat. This is the social-trading company — net contribution of about $0.92 billion trailing — whose CopyTrader network reaches 4.28 million funded accounts, up 18%, with a 34% adjusted EBITDA margin and $1.2 billion of cash against no debt. The growth is 9%: a mature company's growth, not a blitz. And the headline needs unwrapping — 85% of second-quarter gross revenue of $1.59 billion was crypto pass-through of $1.35 billion, which is why the scoring uses net contribution as the economic reality.
What the business does
eToro Group, founded in 2007, is an Israel-domiciled, US-listed social trading and investing platform — Nasdaq: ETOR, listed in May 2025. It offers stocks, exchange-traded funds, cryptoassets and contracts for difference in one app, and its defining product is social trading: CopyTrader lets users copy the strategies of top traders, and Smart Portfolios package strategies for followers. The structure is a two-sided network — more strategy providers make the platform more valuable to followers, and more followers make it more rewarding to providers — and that network is also the distribution channel, because users share and copy strategies rather than the company buying every account through advertising.
The economics need unwrapping, because the headline revenue figure is misleading. Second-quarter 2026 total revenue and income was $1,593.1 million, but $1,346.4 million of that — about 85% — was cryptoasset principal trading passed through to customers, not revenue the company earns. The scoring therefore uses net contribution, the economically real figure: $229 million in the second quarter, up 9% year on year, and about $0.92 billion trailing. The same distinction decides the market gate. On that net-contribution basis the business is profitable and cash-rich: GAAP net income was $53 million in the second quarter, up 77%, adjusted net income $63 million, adjusted EBITDA $78 million, and cash and short-term investments stood at $1.2 billion against no disclosed debt. Funded accounts reached 4.28 million, up 18%, and assets under administration $19.2 billion, up 10%. The second growth curve is the United States: the TradeZero acquisition, agreed at up to $231 million for a business with about $80 million of trailing revenue and a gross margin above 80%, was announced but not closed at the scoring date.
Why the score is what it is
Speed scores 16 out of 25, and the file is explicit that this is a mature company's growth rather than a blitz. The A1 growth item scores 6 out of 10: net contribution up 9%, funded accounts up 18%, assets under administration up 10%, net income up 77%. The 6 reflects the pace — 9% is steady, not explosive — and the fact that total revenue fell 24% year on year, even though that fall was the crypto pass-through shrinking rather than the real business. Capital speed scores 4 out of 5: the IPO, the $1.2 billion cash position, $39 million of second-quarter operating cash flow and $78 million of adjusted EBITDA mean the company funds itself, though operating cash flow is small next to net income and the TradeZero deal mixes cash and stock. Hiring and productivity score 3 out of 5 — the employee count is unconfirmed, so no hiring blitz can be evidenced, though the account base is growing faster than the organisation. Share speed scores 3 out of 5: accounts growing 18% likely beats market growth, but net contribution grew only 9%, so contribution per account is falling, and no direct market-share figure is disclosed.
The moat, at 31 out of 60, is the strongest axis, and it is the only axis where this company beats its own speed. Network effects score 8 out of 18: the CopyTrader network is real and two-sided, but it is tied to trading volume, so in a bear market the effect reverses — fewer trades, less to copy — and it is not the platform lock-in of an operating system. Distribution scores 8 out of 18: social and viral distribution is real, multi-asset and multi-country, and TradeZero adds the United States, but each country's licence is a bottleneck and marketing dependence has not disappeared. Market size scores 7 out of 12: the global retail brokerage revenue pool is above $150 billion, and trailing net contribution of $0.92 billion is about 0.6% of it, so the room is large — but the industry is mature and regulated, and eToro's addressable market is only the retail investors who want social, multi-asset trading, not the whole pool. Gross margin scores 8 out of 12: adjusted EBITDA of $78 million is 34.1% of net contribution, and GAAP net income rose 77%, so scale is showing up as margin — though that margin is tied to trading volume and the exact GAAP operating margin is undisclosed. Creative destruction scores 8 out of 15, the lowest of the three axes: social, commission-free investing is genuinely displacing traditional brokers and advisers for part of retail behaviour, but only part — institutions and high-net-worth clients are untouched — and the cost-structure item scores just 2, because zero commission is already the industry standard, so there is no further structural collapse to claim.
The risks
Deductions total 8 points, and 7 of the 8 sit on two connected exposures: crypto volatility and regulation. The D2 revenue-quality deduction of 3 points reflects crypto dependence — crypto derivatives net trading income swung to plus $19.7 million in the second quarter from minus $8.4 million a year earlier, and cryptoasset revenue falling 30% year on year dragged total revenue down 24%. Net contribution is tied to trading volumes, so a bear market can shrink the revenue base itself, not just the margin. The D4 regulatory deduction of 4 points, the largest single item, reflects that cryptoassets, contracts for difference and copy trading are all regulatory targets: European and British leverage limits, US state-by-state crypto rules, and sales restrictions on CFDs, with copy trading — following another person's strategy — an easy target for investor-protection rules. No specific open regulatory case was confirmed in the reviewed sources, but the exposure is structural to the business rather than incidental. Governance takes a further 1 point: founder Yoni Assia's voting concentration through a dual-class structure is reported but the voting split is unconfirmed, so the file deducts conservatively. Debt is not a risk at all — no borrowings are disclosed, and the D1 item scores 0. Two figures also carry an asterisk: the trailing net contribution of about $0.92 billion is partly estimated — the third quarter of 2025 at $215 million from KBW reporting, the fourth quarter at about $230 million and the first quarter at about $245 million are estimates — and the third-quarter 2026 results, scheduled for 10 November 2026, fall after the scoring date and will allow an exact recomputation.
What would change the score
The score moves on the second curve and on the two connected risks. If TradeZero closes and the United States lifts net-contribution growth into the high double digits, the A1 growth item and the share-speed item both have room to rise — but only if account growth starts translating into contribution per account, reversing the current pattern where accounts grow 18% and contribution 9%. The deductions move the other way if regulation tightens or a bear market arrives: both would hit net contribution and margin together, and the test the file sets is whether the CopyTrader network holds its users through a down market or unwinds. A cleaner regulatory picture, or a falling crypto share of contribution, would ease the two largest deductions. And the estimate asterisk disappears with the third-quarter results: an exact trailing net contribution will settle the gate arithmetic that currently rests on two estimated quarters.
The gates: both pass — on net contribution, not gross revenue
Gate 1, sustained growth or a second growth curve for a mature company, passes on a confirmed basis. Funded accounts grew 18% to 4.28 million, and the second curve is the TradeZero acquisition in the US, at about $80 million trailing with a gross margin above 80%. Gate 2, a ten-year market ceiling at least ten times current revenue, passes as an estimate — on net contribution: measured on gross revenue, the bar would be distorted past $90 billion by the crypto pass-through, and the choice of measure is what decides the gate. The fourth quarter of 2026 has not been reported at T, and its reporting date is unconfirmed — it is not a company-confirmed date and must not be presented as one — and no outcome is anticipated here. That is the balance of the record at T: a profitable social network with a real moat, growing 9%, whose deductions — 7 of the 8 points — are regulation and crypto volatility arriving together.
More Platforms companies
Other Platforms names on the Blitz Index, highest score first: Alphabet (83/A), Meta (78/B), Airbnb (76/B).
Next earnings
Nov 10, 2026 · Before open · Confirmed
Coverage
eToro Group Ltd. · Next earnings unconfirmed at scoring · Score 47 · Grade C
Embed this score
Copy the HTML below to show this score on your site. The badge links back to this page and updates automatically when the score changes.
Preview:
BlitzLab scores businesses against a scholar’s standard — not investment advice. No price targets, no buy/sell recommendations. Figures are from SEC filings (XBRL) as labeled in the source scorecard.